Top Items by Dept/Period
The Top Items by Dept/Period report (the page heading reads Sales History) lists the best-selling items in each department, grouped by day, week, or month.
Customizing your Top Items report

- Top [number] items with highest — enter how many items to list per department, and choose whether to rank them by quantity sold or revenue.
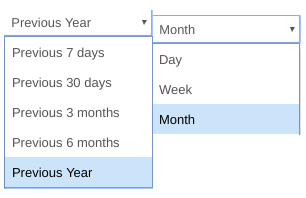
- in the — choose the period: Previous 7 days, Previous 30 days, Previous 3 months, Previous 6 months, Previous Year, or Custom. For Custom, enter a start and end date in the two date fields next to the dropdown (a date picker opens when you click each field).
- grouped by — choose how results are bucketed: Day, Week, or Month. Each group gets its own set of department tables, newest first.
- Optionally narrow the report:
- A division dropdown (All Divisions) appears when your account has more than one division.
- sub-department — limit the report to a single sub-department; entries are listed as "Department / Sub-Department."
- store — on multi-store accounts, a store list lets you report on one or more stores together (ctrl/⌘-click to select more than one).
- Click View.
Viewing the Top Items report table
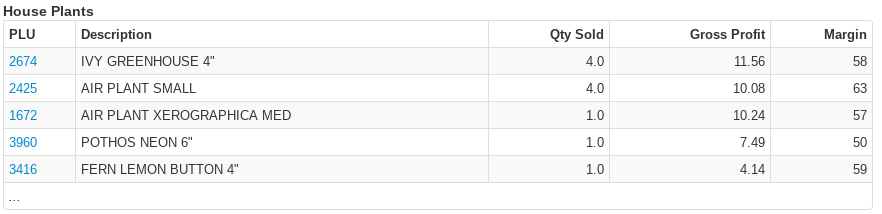
For each period group, the report shows one table per department listing its top items:
- PLU — the item number, linked to the item's page
- Description — the item's description
- Qty Sold — the number of that item sold in the period
- Revenue — the total sales dollars for the item in the period
- Gross Profit — the total gross profit (revenue minus cost) for the item
- Margin — gross profit as a percentage of revenue
A row of "..." at the bottom of a department's table means the department had more items than the number you asked for.