Best/Worst Selling
What's on the Best/Worst Selling Items Report?
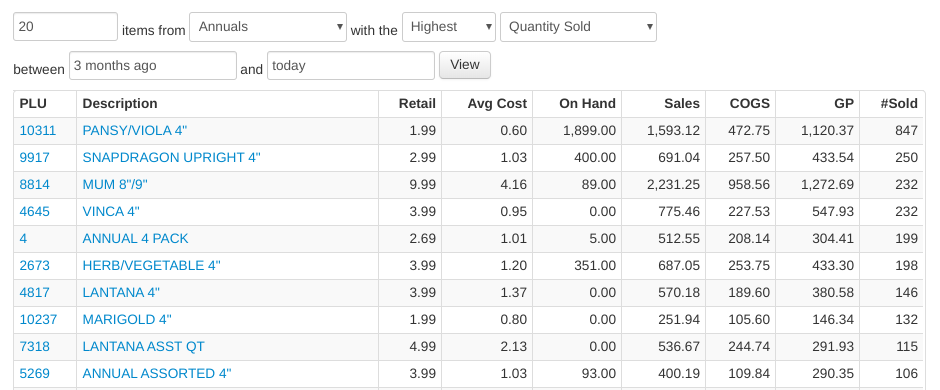
The Best/Worst Selling Items report ranks your items over a date range. Build the ranking with the controls at the top:
- The number of items to show (default 20)
- A department or sub-department, or All Departments
- A vendor (optional)
- Lowest or Highest — worst sellers or best sellers
- The ranking measure: Quantity Sold, Sales $, Quantity On Hand, Gross Profit, or Inv $ (current cost of inventory on hand)
- A division (shown if you have more than one sales division)
- The date range — defaults to the last 3 months
- All stores — if you have multiple stores, check this to rank across all stores instead of only the store you're signed into
Click View to regenerate the report.
Report Columns
For each ranked item, the report shows:
- Rank
- PLU — the item number, linked to the item page
- Description
- Department
- Retail — current price
- Avg Cost — average cost
- Margin — margin percentage based on retail and average cost
- On Hand — current quantity on hand
- Sales — sales dollars in the period
- COGS — cost of goods sold in the period
- GP — gross profit (sales minus COGS) in the period
- #Sold — quantity sold in the period
- Inv $ — on hand × average cost
The totals row sums On Hand, Sales, COGS, GP, #Sold, and Inv $ for the listed items. Use the download icon above the table to export it as a CSV file.