Departments PTD
What's on the Departments PTD report?
The Departments PTD report shows sales, profit, and inventory adjustment totals for every department over one or more periods.
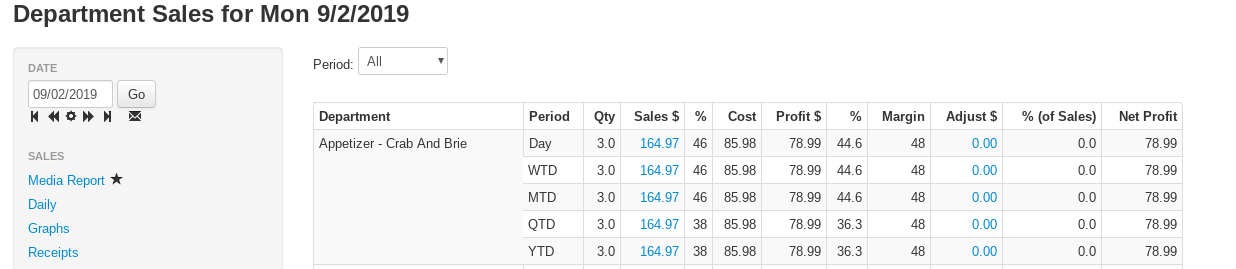
Customizing your Departments PTD report
Use the Period: dropdown at the top of the report to pick All (every period at once — a Day, WTD, MTD, QTD, and YTD row for each department), a single period (Day, WTD, MTD, QTD, or YTD), or Custom. For Custom, enter a start and end date in the two date fields next to the dropdown (a date picker opens when you click each field). Click View to run the report.

Other controls on the Departments PTD report:
- A division dropdown (All Divisions) appears when your account has more than one division. When a single division is selected, the adjustment columns (Adjust $ through Net Margin %) are hidden, since adjustments aren't tracked by division.
- On multi-store accounts, a Choose store... selector (with Deselect and Select All buttons) lets you combine any set of stores.
- The download icon at the top right saves the table as a CSV file.
Tip
When a single period is selected, click any column heading to sort the table by that column.
Departments PTD table columns
- Department — the department name
- Period — which period the row covers (shown only when Period is All)
- Qty — the number of items sold
- Sales $ — total sales dollars from the items sold; click the value to open the Items report for that department and period
- % — the department's percentage of total sales
- Cost — the cost of the items sold
- Profit $ — gross profit (sales minus cost)
- % — the department's percentage of total profit
- Margin — gross margin percentage (labor and fee lines are excluded from the margin calculation)
- Adjust $ — the total cost of inventory adjustments in this department for the period; adjustments include cost changes, quantity changes, warrantied items, and more. Click the value for the department's breakdown on the Adjustments report
- % (of Sales) — adjustment cost as a percentage of sales
- Net Profit — profit after adjustments
- Net Margin % — net profit as a percentage of sales
When a single period is selected, a totals row at the bottom sums each column.