Daily Summary
What's on the Page?
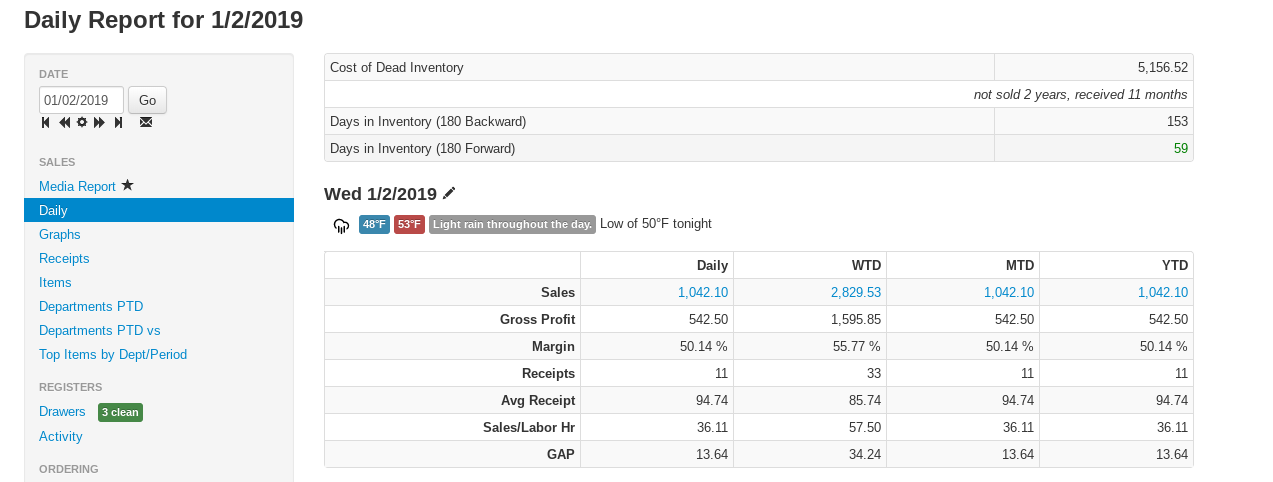
The daily report is the home of the reports tab and shows you general information about sales for that day. Below the date is the automatically generated weather report including an icon depicting general conditions, the low temperature for the morning in blue, the high in red, a summary of conditions, the overnight low, and a notification for national holidays. An up-close example is shown below.

Info
Temperature unit: The weather report shows temperature in Fahrenheit when your store's distance unit is set to MILE (US default) or in Celsius when set to KM (Canadian default). Distance unit lives in Admin → Configuration.
- Sales- See raw sales for the day, week to date, month to date, and year to date, and select the hyperlinked values to be redirected to the item sales for the selected span of time
- Gross Profit- see the gross profit for the day, week to date, month to date, and year to date
- Margin- displays the margin percentage for the day, week to date, month to date, and year to date
- Receipts- displays the number of receipts for the day, week to date, month to date, and year to date
- Average Receipt- See the average sales total for receipts by the day, week to date, month to date, and year to date
- Sales/Labor Hr- view the total sales per labor hour by the day, week to date, month to date, and year to date
- GAP- the gross margin percentage minus labor dollars as a percent of sale. This number is ideally 26-35.
Last Year Comparison Reporting
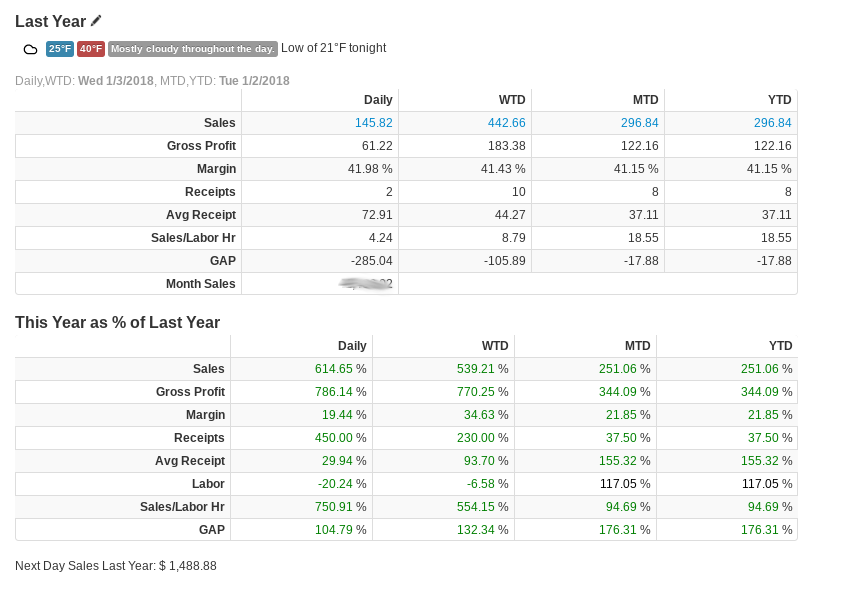
Reporting clarification dates- VMX POS lists the dates used in comparison measures like the "Last Year Comparison" report so you can make the most of your data. As a point-of-sale designed for garden centers, VMX prioritizes the day of the week in daily and weekly reports and the date in monthly and yearly reports. Those details are always listed for you under the weather report in gray text.
This Year as % of Last Year
This report helps you simplify today's data to inform important decisions. View your stats for the day, week to date, month to date, and year to date as a percentage of the same stats from the same time last year. There is also a summary of sales for the same month last year at the bottom of the table. Values highlighted in green are improvements (value moved towards efficiency, or in the recommended range), and values in red are areas to improve in.
Next Day Sales- This value will show you what the total sales for tomorrow's date last year are to help you be prepared for the next day!
See the Daily report's numbers over many periods (Daily Over Time)
To watch the Daily report's key numbers — sales, gross profit, margin, receipts, labor, GAP — move across a whole run of days, weeks, months, or years, use the Daily Over Time report (Reports tab, under the Sales heading, just below Daily). It shows one column per period with a trend sparkline on every row, and adds filters for division, customer class, and department.
One difference on multi-store accounts: the Daily report always shows the store you're signed into, and Daily Over Time does the same by default — but on Daily Over Time a multi-store selector that combines several stores into the same columns can be enabled per-client by VMX (contact help@vmxllc.com).
Filter the Daily report by department
The Daily report (Reports tab → Daily) can be narrowed to one or more departments or sub-departments, so the sales, profit, margin, and receipt tables reflect only those departments:
- Open the Daily report from the Reports tab.
- Click the department selector near the top of the page — it reads All departments... when nothing is selected. You can type in the box to search the list.
- Tick one or more departments. Sub-departments are listed underneath their department as Department / Sub-department — picking a sub-department filters to just that sub-department.
- Click Filter. The report reloads with every sales table recalculated for the selected departments, and a blue note confirms what's active: Filtered to: followed by your selections.
- Click Clear to go back to the full store-wide Daily report.
Two things behave differently while a department filter is active, and the blue note spells both out: labor rows are hidden (labor isn't tracked by department), and inventory figures marked with a * (such as Cost of Inventory) remain store-wide — they are not affected by the department filter.
The department filter is a screen-only control: the automatically emailed copies of the Daily report are always unfiltered. For a scheduled department-level daily email, see "Department Daily report" below.
View the Daily report for every store at once (all-stores Daily report)
On multi-store accounts, an all-stores version of the Daily report shows every location on one page. It isn't linked from the report sidebar — open it directly at /pos/reports/daily_all.php (the report sidebar's date field and back/forward arrows work there just like on the regular Daily report), or receive it by email (see "Get the Daily report by email every evening" below). If your account has only one store, that address simply shows the regular Daily report.
The all-stores Daily report contains:
- A store comparison table at the top — one row per store with that day's Sales, Gross Profit, Margin, Receipts, and Avg. Receipt, so you can compare locations at a glance.
- A company-wide section (headed with your company name) — the familiar Daily report tables computed across all stores combined.
- A section for each store — each with its own weather report, Days in Inventory (6mo Backward) and Days in Inventory (6mo Forward) rows, Cost of Inventory (shown when viewing today), and the same Last Year Comparison and This Year as % of Last Year tables as the single-store Daily report.
Sensitive rows on the Daily report (labor figures such as Labor, OT Labor $, and GP after Labor) appear here under the same rule as everywhere else: the viewing employee needs the See Sensitive Numbers permission.
Get the Daily report by email every evening
The Daily report can be emailed automatically each evening (typically at 7 PM store time — the send time is adjustable per client by VMX). Recipients are managed on the Emails page in Admin (requires admin access to Emails):
- Go to Admin → Emails, on the Emails tab.
- Click New Email.
- In the Message/Report dropdown, choose the Daily report variant you want:
- Daily Report — the standard report.
- Daily Report (Mngt) — the management version, which additionally includes the sensitive labor rows (Labor, OT Labor $, GP after Labor).
- Enter the Recipient Email and save.
On multi-store accounts each variant is listed once per store (for example Daily Report - Main Street) plus an ALL entry (Daily Report - ALL). The per-store entries email that store's Daily report, with the store name appended to the email's subject line; the ALL entry emails the all-stores Daily report — the company-wide totals, per-store comparison table, and a section for every location, as described in "View the Daily report for every store at once" above.
Department Daily report (a Daily report for one department)
The Department Daily report is a version of the Daily report computed for a single department or a named group of departments — the same sales, gross profit, margin, and receipts tables with day / week-to-date / month-to-date / year-to-date columns and last-year comparisons, but limited to that department's items. The page is titled Daily Dept Report followed by the department name and date. On multi-store accounts there is also an all-stores version showing a company-wide section, a section per store, and a per-store comparison table (Sales, Gross Profit, Margin, Receipts, Avg. Receipt), mirroring the all-stores Daily report.
This report is designed to arrive by email: a scheduled evening email that sends each department manager their own department's daily numbers is set up per-client by VMX — contact help@vmxllc.com if you'd like department daily emails configured for your store (which departments, who receives them, and whether they include the management-only rows).
For an on-screen look at one department's daily numbers, you don't need this report at all — use the department filter on the regular Daily report (Reports tab → Daily, then the All departments... selector and Filter button), described in "Filter the Daily report by department" above.
Don't confuse the Department Daily report with the Departments PTD report (Reports tab → Departments PTD): Departments PTD lists every department as rows in one table so you can compare departments against each other for a period, while the Department Daily report is the full Daily report layout for one department (or department group) at a time.