Open to Buy
What's on the Page?
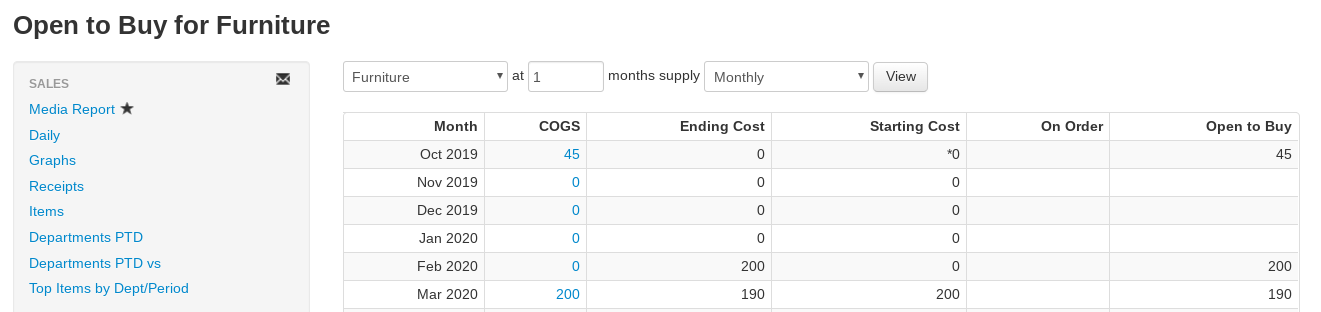
The Open to Buy report forecasts, week by week or month by month, how many dollars of inventory you can bring in for a department while still selling down to your target supply level.
- Department drop-down — Select the department to report on, or All Departments for the whole store. The first department is selected by default.
- Supply field — The number of months supply (or weeks supply, when the frequency is Weekly) you want to keep on hand. This is often determined using the relative turn of a department. For example, some garden centers want to order and sell down on pottery every six months, so they would select "Pottery" as the department and enter "6" months supply. If the department has an Annual Turns value set (on the Inventory > Departments page, edit icon), that value determines the default supply window; otherwise the default is 4 months.
- All Divisions drop-down — Optionally limit sales history to one division (shown when your company has more than one division).
- Monthly / Weekly drop-down — Choose whether each report row is a month or a week.
- All Brands drop-down — Optionally limit the report to a single brand.
- All Stores checkbox — For multi-store companies, combine every store into one company-wide view.
- View — Select this button to regenerate the report after changing the input fields.
Reading the Open to Buy Report
Each row of the Open to Buy report is one month (or one week, in Weekly mode). Monthly mode continues out 24 months (two years); Weekly mode continues out 48 weeks, so a full year ahead is visible when you're placing next season's orders.
- Month/Week — The month (or the week's start date) the row covers.
- COGS — The estimated cost of the goods you'll sell during that month or week, based on the average of the same period over the previous three years. Click the number to see each historical year's actual figure. The first row is prorated for the portion of the current period that's already passed.
- Ending Cost — The estimated cost of inventory you should still have at the end of the row's period — enough to cover the next N periods of projected sales, where N is your supply setting.
- Starting Cost — The estimated cost of inventory at the start of the row's period. The first row uses your current on-hand inventory cost (excluding slow-selling "dead" inventory — see below); each later row starts where the previous row ended.
- On Order — The cost of inventory already on Purchase Orders expected to arrive in that period. Click the number to see each PO, its vendor, expected date, and amount.
- Open to Buy — The recommended amount to spend on inventory in that period: projected sales (COGS) plus the target ending inventory, minus what you'll already have on hand and on order. When a period's Open to Buy is negative (you're overbought), the column shows the shortfall in gray parentheses instead of an amount to spend, and the shortfall is carried forward into the next period.
Slow-selling inventory and the Starting Cost
The first row's Starting Cost excludes "dead" inventory — items that haven't sold in 2 years or been received in 11 months. A footnote below the table shows the excluded dollar amount, marked with an asterisk (*), and links to the Items Not Selling report so you can review those items.
"Submitted Orders Not in the Forecast Above"
If some of your purchase orders have no usable expected-delivery date — either blank, or a date already in the past — they can't be placed in the forecast calendar, so the report lists them in a separate table (PO#, Vendor, Expected, $ Ordered) at the bottom. Set or update the expected date on each of those POs to bring them back into the Open to Buy forecast.